|
by Erik VELASCO and Matthias ROTH
 eterioration of the atmospheric environment is one of the consequences associated with the increasing number of large cities, which have emerged as the most visible physical sign of anthropogenic global change. Clean urban environments however, are necessary to ensure public health, promote financial investment, local economic growth and international competitiveness - all of which are only possible by protecting the quality of the urban atmosphere. Cities also have crucial roles to play in mitigating climate change. eterioration of the atmospheric environment is one of the consequences associated with the increasing number of large cities, which have emerged as the most visible physical sign of anthropogenic global change. Clean urban environments however, are necessary to ensure public health, promote financial investment, local economic growth and international competitiveness - all of which are only possible by protecting the quality of the urban atmosphere. Cities also have crucial roles to play in mitigating climate change.
Urbanization is predicted to accelerate with a doubling of urban population within the next two decades. Much of this growth will be occurring in Asia. The Association of Southeast Asia Nations (ASEAN), for example, already concentrates 12% of its population in urban centres with over one million inhabitants, including one megacity (Manila) and four cities classified as "megacities in waiting" (Jakarta, Kuala Lumpur, Bangkok and Ho Chi Minh City). The predicted increase in urbanization and industrialization and thus, higher demand for energy and transport will result in the greater use of fossil fuels. Atmospheric emissions of waste heat, carbon dioxide and air pollutants associated with these activities will lead to a decrease of the environmental quality in the absence of effective emissions and air quality control regulations.
 There is growing recognition that the influence of airborne emissions from urban areas on air quality and climate is not restricted to local areas only, but affects the environment on regional and even global scales. These emissions change the chemical content of the atmosphere in a number of fundamental ways. Emissions of nitrogen oxides (NOx), carbon moNOxide (CO) and volatile organic compounds (VOCs) drive the formation of photochemical smog, degrading air quality and threatening both human and ecosystem health. On a larger scale, these same emissions drive the production of ozone, a toxic and powerful greenhouse gas in the troposphere. NOx and sulfur oxide (SO2) emissions contribute to the acidification of lakes, streams, and sensitive ecosystems through acid rain on regional to continental scales. Direct emissions of particles together with aerosols formed by chemical reactions of primary emitted gases such as NOx, VOCs and SO2, result in copious amount of particles that affect both the local air quality and the cloud formation hundreds to thousands of kilometres downwind. At the global scale, Asia is the region with the largest emission of particles and SO2, making it an important source for trans-boundary pollution. In addition, urban areas are also major sources of anthropogenic greenhouse gases (up to 90% of the global total) such as carbon dioxide (CO2), methane (CH4), nitrous oxide (N2O) and halocarbons. There is growing recognition that the influence of airborne emissions from urban areas on air quality and climate is not restricted to local areas only, but affects the environment on regional and even global scales. These emissions change the chemical content of the atmosphere in a number of fundamental ways. Emissions of nitrogen oxides (NOx), carbon moNOxide (CO) and volatile organic compounds (VOCs) drive the formation of photochemical smog, degrading air quality and threatening both human and ecosystem health. On a larger scale, these same emissions drive the production of ozone, a toxic and powerful greenhouse gas in the troposphere. NOx and sulfur oxide (SO2) emissions contribute to the acidification of lakes, streams, and sensitive ecosystems through acid rain on regional to continental scales. Direct emissions of particles together with aerosols formed by chemical reactions of primary emitted gases such as NOx, VOCs and SO2, result in copious amount of particles that affect both the local air quality and the cloud formation hundreds to thousands of kilometres downwind. At the global scale, Asia is the region with the largest emission of particles and SO2, making it an important source for trans-boundary pollution. In addition, urban areas are also major sources of anthropogenic greenhouse gases (up to 90% of the global total) such as carbon dioxide (CO2), methane (CH4), nitrous oxide (N2O) and halocarbons.
Accurate and comprehensive emission inventories are needed as a foundation for determining the geographic distribution of pollutants, the evolution of their chemical and physical properties and their impact on human health and ecosystems. Similarly, accurate estimates of emission rates and patterns of pollutants are necessary to support effective air quality management strategies. Emission inventories are typically constructed through a data aggregation process that accounts for emission rates, activity levels, and source distributions. Emission rates are often derived from laboratory measurements (e.g. vehicle dynamometer studies), activity levels can be obtained from traffic counts or surveys of sources, and source distributions may come from roadway maps, aerial photographs or estimated from population density. However, the propagation of errors associated with this data process can result in large uncertainties that reduce the utility of emission inventories and consequently impede the air quality management process.
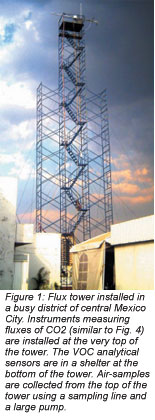
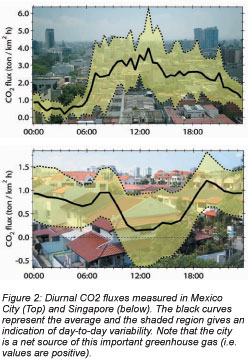 One way to evaluate emission inventories from urban areas is to make direct measurements of the mass of pollutants that moves vertically through a unit of area per unit of time. These measurements are known as turbulent fluxes and are conducted at the top of tall towers (see Fig. 1) to include all major and minor industrial, commercial, residential and mobile emissions sources from a pre-determined neighbourhood. These direct measurements can then be compared with the emissions estimated by the emissions inventory for that particular area. These techniques have been successfully applied to evaluate fluxes of energy (heat flux) and mass (water, CO2, CH4 and selected species of VOCs) from forests and croplands. During the last decade, the same techniques have been used in urban environments to measure energy, mass and CO2 fluxes, and more recently fluxes of VOCs and aerosols. The work presented in the following includes examples of such measurements carried out in two tropical cities, Mexico City and Singapore, respectively (see Fig. 2). One way to evaluate emission inventories from urban areas is to make direct measurements of the mass of pollutants that moves vertically through a unit of area per unit of time. These measurements are known as turbulent fluxes and are conducted at the top of tall towers (see Fig. 1) to include all major and minor industrial, commercial, residential and mobile emissions sources from a pre-determined neighbourhood. These direct measurements can then be compared with the emissions estimated by the emissions inventory for that particular area. These techniques have been successfully applied to evaluate fluxes of energy (heat flux) and mass (water, CO2, CH4 and selected species of VOCs) from forests and croplands. During the last decade, the same techniques have been used in urban environments to measure energy, mass and CO2 fluxes, and more recently fluxes of VOCs and aerosols. The work presented in the following includes examples of such measurements carried out in two tropical cities, Mexico City and Singapore, respectively (see Fig. 2).
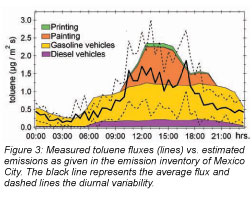
Erik Velasco from National University of Singapore's (NUS) Department of Geography, in collaboration with researchers from Washington State University (WSU) and the Molina Center for Energy and the Environment (MCE2), have demonstrated the feasibility of these direct measurement systems to evaluate urban emissions of selected pollutants from a couple of residential districts of Mexico City as part of two short-term field campaigns. Among the monitored pollutants were CO2, toluene, benzene, methanol and other reactive and toxic VOCs. The flux measurements were analyzed in terms of diurnal patterns and compared to the local emission inventory. In both districts, the results showed that the urban surface of Mexico City is a net source of CO2 and VOCs with significant contributions from vehicular traffic. The data showed that the emission inventory is in reasonable agreement with the measured fluxes. For the particular case of toluene, it was found that the evaporative emissions from workshops, painting and solvent use were overestimated in the inventory , as shown in Fig. 3. In contrast, the methanol emissions from vehicle exhaust were not included in the inventory. This information has been useful to the local environmental agency for improving the emissions inventory and for the design of new emission regulations.
 Since 2006 Matthias Roth, also from the Department of Geography at NUS, has measured CO2 fluxes over a residential neighbourhood of Singapore (Telok Kurau). The results show that the built-up parts of this city are also a constant source of carbon dioxide, although the absolute values are smaller than those observed in Mexico City. This is due to the different characteristics of the monitored sites - the towers in Mexico City were located in busy districts characterized by heavy traffic. This contrasts Telok Kurau, which is a residential neighbourhood with lower population density and fewer cars. In Singapore, the fluxes are highest during the early morning and late evening when the traffic volume peaks. During daytime the extended vegetation cover absorbs a fraction of the anthropogenic CO2. However, the fluxes are still positive on average. In Mexico City, the vegetation cover is much reduced and therefore the biogenic CO2 uptake is negligible. Since 2006 Matthias Roth, also from the Department of Geography at NUS, has measured CO2 fluxes over a residential neighbourhood of Singapore (Telok Kurau). The results show that the built-up parts of this city are also a constant source of carbon dioxide, although the absolute values are smaller than those observed in Mexico City. This is due to the different characteristics of the monitored sites - the towers in Mexico City were located in busy districts characterized by heavy traffic. This contrasts Telok Kurau, which is a residential neighbourhood with lower population density and fewer cars. In Singapore, the fluxes are highest during the early morning and late evening when the traffic volume peaks. During daytime the extended vegetation cover absorbs a fraction of the anthropogenic CO2. However, the fluxes are still positive on average. In Mexico City, the vegetation cover is much reduced and therefore the biogenic CO2 uptake is negligible.
The results from these urban studies, are amongst the first of their kind. They confirm that cities are major emitters of greenhouse gases. Also considering other air pollutants and aerosols, cities are therefore sources of most of the agents that are known to alter the state of the global atmosphere and the climate. This highlights the important role cities have in mitigating global climate change. Reducing emissions of greenhouse and pollutant gases associated with the inefficiency in urban energy use (from transport to inappropriate urban design) should therefore be made a priority.
 Click here to download the full issue for USD 6.50 Click here to download the full issue for USD 6.50
|