|
by Mok Hui Min and Nicholas Ng
Abstract
In modern medical usage, electroencephalograms (EEG) are typically utilized to record brain waves in clinical neuroscience. While research has been done by countless of others on improving the way brain waves are interpreted on certain types of patients, little or none of these has been directed into the field of epilepsy. EEG data from epilepsy patients are usually transmitted as vast amounts of graphing data from which doctors have to plough through. This requires unnecessary effort and time. In this paper, therefore, we will explore the use of computer graphics as a means of representing and analyzing brain waves recorded by the EEG for epilepsy patients to better aid the scientific community.
Introduction
EEG is a tool used to convert electrical activity of brain neurons into signal records [1]. The first EEG analysis was carried out by Hans Berger in 1929 [2], intended to study brain diseases such as epilepsy. The waveforms recorded from the said EEG analysis reflect the activity of the cortex, a key component of the brain.
Epilepsy is usually diagnosed to a person who repeatedly experiences epileptic seizures. Epileptic seizures themselves, however, manifest in a plethora of ways, such as impairment of motor skills, sensory disturbances, or psychological changes. Nearly any component of the human brain can potentially be affected by an epileptic seizure. As a result, there are many outward symptoms of an epileptic seizure. Types of epilepsy include: idiopathic, cryptogenic, and symptomatic. Most epilepsy cases are caused by the remnants of a cerebral disorder that occurred in the past [3].
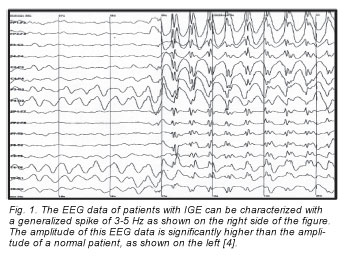 The most common type of epilepsy [4], idiopathic generalized epilepsies (IGE), can be characterized by a "generalized spike or polyspike and slow wave discharge at 3-5 Hz, normal background cerebral activity, and a relatively high incidence of photosensitivity." Other forms of epilepsy have also been characterized via EEG data through previous researchers. Hence, the presence of these abnormalities in EEG signals serves as a clear indicator of epilepsy, and this will be used as a springboard for this paper by acting as a baseline measurement in our findings. The most common type of epilepsy [4], idiopathic generalized epilepsies (IGE), can be characterized by a "generalized spike or polyspike and slow wave discharge at 3-5 Hz, normal background cerebral activity, and a relatively high incidence of photosensitivity." Other forms of epilepsy have also been characterized via EEG data through previous researchers. Hence, the presence of these abnormalities in EEG signals serves as a clear indicator of epilepsy, and this will be used as a springboard for this paper by acting as a baseline measurement in our findings.
The analysis of EEG signals in epilepsy patients is not only limited to these. Further research has also discovered that epileptic seizures can be forecasted by classifying EEG signals [5]. This has been tremendously helpful to the scientific community, and has aided countless of doctors in the early diagnosis of potential epilepsy patients.
Lastly, research has highlighted the two most evident differences between the EEG data of epilepsy patients and normal patients. They are namely, (1) The amplitude of the voltage measured and (2) The presence of any repeated patterns or consistency in EEG signals over time (as seen in Figure 1 and elaborated by [4]).
Aims
The central focus of this paper primarily revolves around epilepsy. This paper aims to investigate the variation in brain activity in epilepsy patients during an epileptic seizure by providing a groundbreaking and unique way of reading EEG data. Utilizing past research on EEG data for epilepsy patients, computer graphics can be manipulated according to the disparity between incoming EEG signals and a known threshold (explained later). This aids in the creation of a virtual reality (VR) that allows for a clearer diagnosis of epilepsy.
By infusing EEG data with a more artful form of computer graphic, processing the data becomes much easier. This also allows laymen to be easily able to differentiate the EEG signals of patients experiencing epilepsy attacks and the EEG signals of normal patients.
Methodology
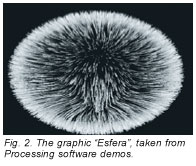
Using processing.org, we aim to select an appropriate graphic that can be effectively manipulated to allow it to display EEG data in a comprehensive manner. The graphic "Esfera" was selected due to its ability to be modified on various levels, such as its length.
 Utilizing various programming techniques, EEG data can be used to represent a specific aspect of the graphic, and by allowing it to vary with the EEG data given, we aim to investigate the most effective way of differentiating the EEG data. For example, the length of the spikes of the ball in "Esfera" could be matched to the amplitude of the EEG data over a period of time. In this case, the length of spikes would be used as the differentiating factor for the EEG data between epilepsy and normal patients. Utilizing various programming techniques, EEG data can be used to represent a specific aspect of the graphic, and by allowing it to vary with the EEG data given, we aim to investigate the most effective way of differentiating the EEG data. For example, the length of the spikes of the ball in "Esfera" could be matched to the amplitude of the EEG data over a period of time. In this case, the length of spikes would be used as the differentiating factor for the EEG data between epilepsy and normal patients.
In this paper, we will be varying three different aspects independently: the length, color and thickness of the spikes.
Our clinical EEG data was obtained from a patient with clinically diagnosed absence epilepsy from the Department of Neurology, University Hospital Schleswig-Holsten in Kiel, Germany and from the Department of Neurology, Inselspital, Bern, Switzerland sampled at 256 Hz and referenced using the Hjorth method [6].
(I) Identifying Correct Spikes in Epileptic EEG [7]
While diagnosing for epilepsy from EEG data, awareness of the constitution of a spike that indicates an epileptic seizure should be established beforehand. A spike is typically observed as a conspicuous jump in amplitude of EEG data. However, not all spikes are signs of an epileptic seizure. The following paragraphs will elaborate on this, adapted from [7].
First and foremost, when a spike of amplitude with less than 50 microvolts is observed, this more often than not implies a diphasic small sharp spike. This will usually occur in the temporal region, during drowsiness or stage one or stage two sleep. Research has indicated that this occurs in over 20% of normal and epileptic patients. As such, they are mild and often have no significance in diagnosing epilepsy. Should these forms of EEG feedback occur, it must not be taken into account while diagnosing for epilepsy.
Next, another type of discharge includes benign focal epileptiform discharges. These are usually around 20-75 microvolts, but their amplitudes can occasionally exceed 100 microvolts. They are typically found in the occipital area. These forms of EEG feedback are significant and should be accounted for.
Finally, high-voltage waves are associated with pathological spike and wave activity in which the spikes are more drastic. An absence of a clear 3Hz spike and wave response confirms the pathogenicity of the epilepsy attack. It usually has amplitudes exceeding 100 microvolts and in extreme cases even exceeding 350 microvolts. These should be taken as the confirmatory test in the diagnosing of epilepsy.
(II) Thickness Demo
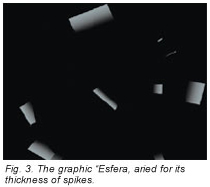 The first aspect that was experimented with was the thickness of the spikes. Thickness, which is the diameter of the spikes in "Esfera" is made to vary according to the amplitude of the EEG data given. Specifically, the higher the amplitude of the voltage in the EEG data, the thicker the spikes will be. Hence, in general, the thickness of spikes will be thinner when EEG data of normal patients are used and thicker when EEG data of epilepsy patients having epileptic seizures are used. This is an appropriate way of displaying EEG data as it closely imitates the effects epileptic seizures have on EEG data. The first aspect that was experimented with was the thickness of the spikes. Thickness, which is the diameter of the spikes in "Esfera" is made to vary according to the amplitude of the EEG data given. Specifically, the higher the amplitude of the voltage in the EEG data, the thicker the spikes will be. Hence, in general, the thickness of spikes will be thinner when EEG data of normal patients are used and thicker when EEG data of epilepsy patients having epileptic seizures are used. This is an appropriate way of displaying EEG data as it closely imitates the effects epileptic seizures have on EEG data.
In programming language, the "strokeweight( )" command is made to vary with the EEG data that is input. Every 1 stroke increase corresponds to 10 microvolts.
 As shown above, varying the thickness of the "Esfera" graphic displays a distinct difference not only in the thickness but also causes the whitish color of the spikes to be richer and more prominent. As shown above, varying the thickness of the "Esfera" graphic displays a distinct difference not only in the thickness but also causes the whitish color of the spikes to be richer and more prominent.
(III) Color Demo
The second aspect that was experimented with was the color of the spikes. The colors that were selected are: light green, blue and purple. This was made to vary according to the amplitude of the EEG data.
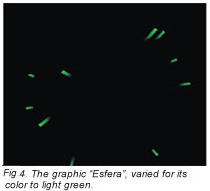
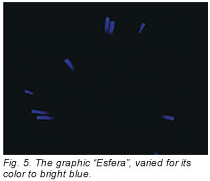
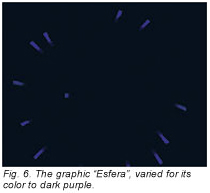
For readings below 50 microvolts, the spikes would register a light green color (corresponding to a small sharp spike). For readings between 50-100 microvolts, the spikes would register a blue color (corresponding to a benign focal epileptiform discharge). For readings above 100 microvolts, the spikes would register a purple color (corresponding to a pathological spike and a high chance of diagnosis for epilepsy). Hence, in general, normal patients will see brighter colors in their EEG readings while epilepsy patients facing an epileptic seizure will see darker colors in their EEG readings.
 In programming language, the "strokeweight( )" is made to vary according to the amplitude. For readings below 50 microvolts, stroke (3, 200, 0) is coded to produce a light green color as shown below. This corresponds to lower EEG voltages. In programming language, the "strokeweight( )" is made to vary according to the amplitude. For readings below 50 microvolts, stroke (3, 200, 0) is coded to produce a light green color as shown below. This corresponds to lower EEG voltages.
For readings between 50-100 microvolts, stroke (0, 0, 200) is coded to produce a bright blue color as shown below. This indicates benign focal epileptic EEG data or mid-range to higher EEG voltages.
For readings above 100 microvolts, stroke (64, 0, 99) is coded to produce a dark purple color as shown in Figure 6 . This indicates an EEG data with pathological spikes.
(IV) Length Demo
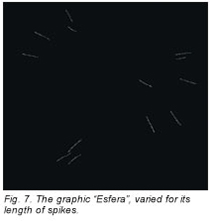
 The final aspect that was experimented with was the length of the spikes. The length of the spikes was made to vary according to the EEG data. Specifically - the lower the amplitude of the voltage in the EEG data, the shorter the length of the spikes, and vice versa. Hence, in general, normal patients would see shorter spikes and epilepsy patients would register longer spikes. The final aspect that was experimented with was the length of the spikes. The length of the spikes was made to vary according to the EEG data. Specifically - the lower the amplitude of the voltage in the EEG data, the shorter the length of the spikes, and vice versa. Hence, in general, normal patients would see shorter spikes and epilepsy patients would register longer spikes.
In programming language, the stroke( ) command is made to vary with the EEG data that is input. Every 1 stroke increase corresponds to 10 microvolts.
(V) Mini Survey
To evaluate the effectiveness of our "Esfera" graphics in providing a simple and creative way to distinguish EEG data during epileptic seizures and from normal patients, we conducted a survey on 23 people. The results are as follows.
Firstly, we explained how the amplitude of EEG data spiked when obtained during epileptic seizures. We then showed our three graphics and asked respondents to identify which was obtained during epileptic seizures and which was obtained from normal patients. All respondents had no difficulty in distinguishing the EEG data when thickness and color was varied. However, some respondents hesitated with distinguishing the EEG data when length was varied. Some even gave wrong answers. General feedback was that it was difficult to see the difference in the length of the spikes in three dimensions.
 Secondly, we asked respondents which graphic was most effective in helping them to visualize and differentiate the EEG data. About three quarter of the respondents indicated that color was most effective as the color difference was the easiest to tell as opposed to the length or thickness difference. Secondly, we asked respondents which graphic was most effective in helping them to visualize and differentiate the EEG data. About three quarter of the respondents indicated that color was most effective as the color difference was the easiest to tell as opposed to the length or thickness difference.
In the case of thickness, there was feedback given that the spikes may overlap each other on the graphic when they reach a certain thickness. As the spikes have the same color, it might be difficult to distinguish each individual spike from another when the spikes are thick enough.
Discussion and Conclusion
Between the three graphical aspects of the virtual realities, we found that the Color Demo was the most informative in representing EEG data. It accurately and clearly reflects EEG data, allowing users to track the values of the voltage of the data with relative ease.
A research has shown that “Color can improve comprehension by 73 percent" [8]. People cannot process every object within view at one time. Therefore, color can be used as a tool to emphasize or de-emphasize areas. Color can be used to highlight important parts that we want to make distinct or obvious. Human's senses tend to be more sensitive to color changes as well. This is seen from tests that indicate "a black and white image may sustain interest for less than two-thirds a second, whereas a colored image may hold the attention for two seconds or more." [9]. People cannot process every object within view at one time. Therefore, color can be used as a tool to emphasize or de-emphasize areas.
While the Length and Thickness Demos do provide the same accuracy in reflecting the data, they do so less clearly, due to ambiguity in distinguishing the sizes of the spikes.
As such, we conclude that color is the most effective variable to be used in our graphics to aid in the differentiation of epileptic EEG data from normal EEG data.
 Click here to download the full issue for USD 6.50 Click here to download the full issue for USD 6.50
|